Quick Answer
Median house prices, rental yields, vacancy rates, and growth data for every major St George suburb — sourced from CoreLogic, Domain, SQM Research, and ABS. Updated April 2026.
Best Suburbs to Buy in St George 2026: Median Prices, Yields & Growth Data
Michael Kalinovski | Updated 9 April 2026 | 12 min read
$1.85M — The median house price across the six highest-demand suburbs in St George as of Q1 2026, representing 15.5% above the Sydney-wide median of $1.60M. St George rental vacancy sits at just 1.1% — one of the tightest sub-regions in Greater Sydney. (Sources: CoreLogic via YourInvestmentPropertyMag, Cotality/CoreLogic, SQM Research — Q1 2026)
Key Takeaways
→ $2.20M median house price in Hurstville — the most expensive suburb in St George, with 8.91% annual growth and 143 house sales in 12 months (CoreLogic via YourInvestmentPropertyMag, Q1 2026)
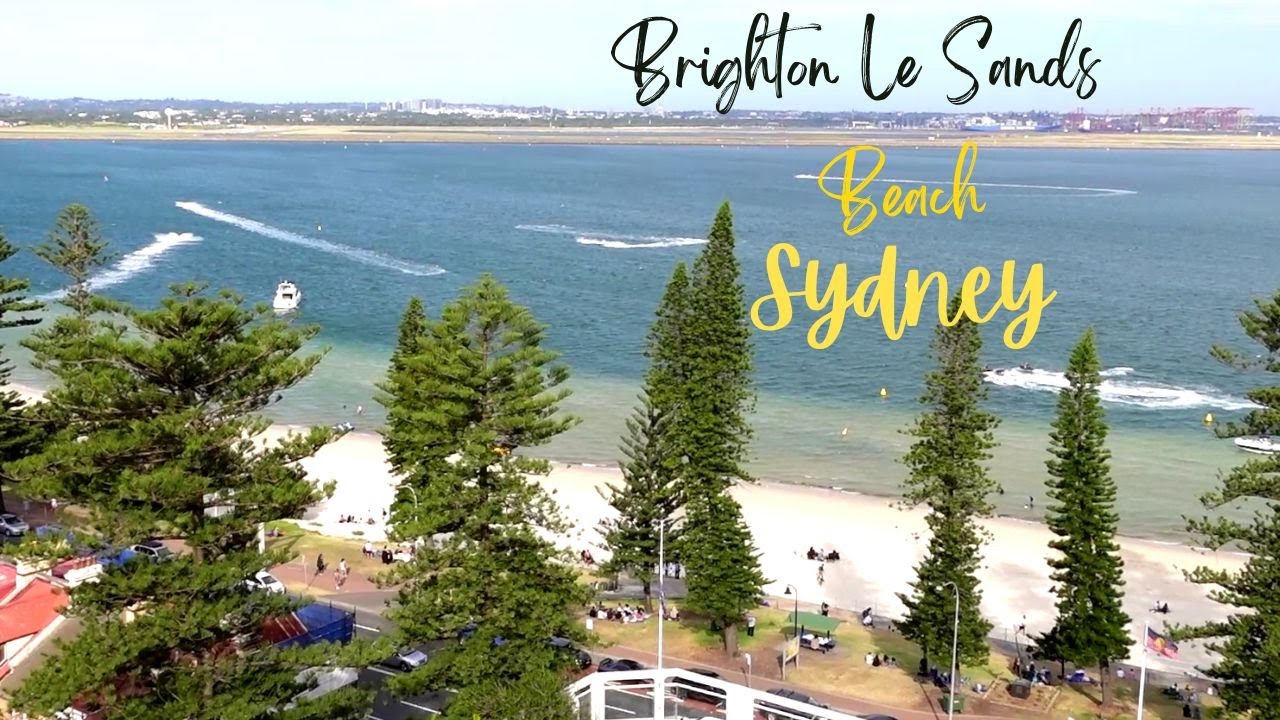
→ $2.15M median house price in Brighton-Le-Sands — 7.5% annual growth, with units returning 4.09% gross yield at $907,500 median (Domain, PropertyValue — Q1 2026)
→ 1.1% vacancy rate across St George — down from 1.3% in July 2025, making it tighter than the 1.3% Sydney-wide average (SQM Research, February 2026)
→ Banksia offers the lowest entry point at $645K median unit price with the highest unit yield in the dataset at 5.19% gross (YourInvestmentPropertyMag, Q1 2026)
→ Bexley houses sell in 27 days on average with 8% annual growth to $1.85M — outpacing both Rockdale and Penshurst on speed and growth rate (Domain, Q1 2026)
→ Kogarah units deliver 4.3–5.06% gross yield at a $730K–$745K median, with 344 unit sales in 12 months — the highest transaction volume of any St George suburb for units (YourInvestmentPropertyMag, PropertyValue — Q1 2026)
→ Sydney's median house price reached $1,601,782 in March 2026 (Cotality/CoreLogic), with Domain forecasting a further 7% rise to $1.92M by December 2026
→ RBA cash rate at 3.85% (February 2026), with major bank forecasts ranging from +2.5% (ANZ) to +5% (Westpac) for Sydney house price growth through 2026 (RBA, Westpac, NAB, CBA, ANZ)
Suburb-by-Suburb Price and Yield Data (Q1 2026)
| Suburb | Median House | Annual Growth | Gross Yield (Houses) | Median Unit | Unit Yield | Source |
|---|---|---|---|---|---|---|
| Hurstville | $2,200,000 | +8.91% | 2.39% | $775,000 | 4.96% | CoreLogic via YIP |
| Brighton-Le-Sands | $2,150,000 | +7.5% | 2.45% | $907,500 | 4.09% | Domain, PropertyValue |
| Penshurst | $1,930,000 | +5.75% | 2.52% | — | — | YIP, PropertyValue |
| Bexley | $1,850,000 | +8.0% | 2.9% | — | — | Domain |
| Rockdale | $1,750,000 | +5.8% | — | — | — | CoreLogic, PropertyValue |
| Banksia | $1,800,000 | +4.35% | 2.84% | $645,000 | 5.19% | YIP, PropertyValue |
| Kogarah | — | — | — | $730,000 | 5.06% | YIP |
All figures represent 12-month rolling medians sourced from CoreLogic, Domain.com.au, PropertyValue.com.au, and YourInvestmentPropertyMag.com.au as of Q1 2026. Dashes indicate insufficient data or suppressed results due to low sample sizes.
Hurstville: The Commercial Hub With 8.91% Growth
| Metric | Value | Source |
|---|---|---|
| Median House Price | $2,200,000 | CoreLogic via YIP, Q1 2026 |
| Annual Capital Growth | +8.91% | CoreLogic via YIP |
| Median Unit Price | $775,000 | CoreLogic via YIP |
| Unit Rental Yield | 4.96% | CoreLogic via YIP |
| House Sales (12 months) | 143 | PropertyValue |
| Average Days on Market | 41 | PropertyValue |
| Median Weekly Rent (Houses) | $880 | CoreLogic via YIP |
| Median Weekly Rent (Units) | $720 | CoreLogic via YIP |
$2,200,000 median with 8.91% annual growth — Hurstville's house market has been the strongest performer in St George by capital appreciation. Unit investors benefit from 4.96% gross yield, among the highest in the region. (CoreLogic via YourInvestmentPropertyMag, Q1 2026)
Hurstville functions as St George's commercial and transport centre. The T4 Illawarra Line and extensive bus network make it the most connected suburb in the region, with direct CBD access in approximately 25 minutes. This infrastructure advantage drives consistent demand across both owner-occupier and investor segments.
The unit market is particularly notable: 495 unit sales in the past 12 months (CoreLogic via YIP) indicate deep liquidity — a critical factor for investors considering St George. At $775,000 median with $720/week rent, the 4.96% gross yield outperforms every other suburb in this analysis for units except Banksia and Kogarah. First-home buyers exploring the region will find Hurstville units offer the strongest combination of yield and transport access.
Brighton-Le-Sands: Lifestyle Premium With 7.5% Growth
| Metric | Value | Source |
|---|---|---|
| Median House Price | $2,150,000 | Domain, PropertyValue, Q1 2026 |
| Annual Capital Growth (Houses) | +7.5% | Domain, PropertyValue |
| Median Unit Price | $907,500 | Domain, PropertyValue |
| Annual Capital Growth (Units) | +11.0% | Domain, PropertyValue |
| House Rental Yield | 2.45% | YourInvestmentPropertyMag |
| Unit Rental Yield | 4.09% | YourInvestmentPropertyMag |
| House Sales (12 months) | 35 | Domain |
| Average Days on Market | 47 | Domain |
+11.0% annual growth for units — Brighton-Le-Sands units have been the fastest-appreciating asset class across all St George suburbs, lifting the median to $907,500. (Domain, PropertyValue — Q1 2026)
Brighton-Le-Sands commands the highest lifestyle premium in St George. The Botany Bay beachfront, Bay Street dining strip, and Cook Park create a coastal village atmosphere that consistently attracts premium buyers. With only 35 house sales recorded in 12 months (Domain), supply scarcity reinforces price resilience.
The east-side premium remains significant: properties east of Bay Street (beach side) typically sell 15–20% above the suburb median, a pattern documented across our Brighton-Le-Sands suburb profile. For sellers, the cost of selling in Brighton-Le-Sands should factor in this premium positioning. The relatively low 2.45% house yield reflects capital growth orientation — buyers here prioritise long-term appreciation over rental income.
Bexley: Emerging Growth at 8% With Faster Sales
| Metric | Value | Source |
|---|---|---|
| Median House Price | $1,850,000 | Domain, Q1 2026 |
| Annual Capital Growth | +8.0% | Domain |
| Gross Rental Yield (Houses) | 2.9% | Domain |
| Average Days on Market | 27 | Domain |
| Entry-Level House Price | ~$1,450,000 | Domain |
| 3-Bed House Median | $1,612,750 | Domain |
| 4-Bed House Median | $1,810,000 | Domain |
| Auction Clearance (3-bed) | 74% | Domain |
27 days average time on market — Bexley houses sell faster than every other suburb in this analysis except Rockdale (26 days), signalling strong buyer competition at a lower entry point than Brighton-Le-Sands or Hurstville. (Domain, Q1 2026)
Bexley sits 14km from the Sydney CBD and benefits from the same infrastructure tailwinds lifting the broader St George region. The 8% annual growth rate outpaces both Rockdale (+5.8%) and Penshurst (+5.75%), suggesting Bexley is in a catch-up phase as buyers recognise its relative value.
The entry-level price of approximately $1,450,000 (Domain) offers a significant discount to Brighton-Le-Sands ($2,150,000) and Hurstville ($2,200,000) while delivering stronger percentage growth. Families should note the school catchments including Rockdale Public School and Bexley North Public School. For detailed street-level guidance in the 2216 postcode, our analysis covers the premium and value pockets within Bexley and adjacent suburbs.
Rockdale: Transport-Led Value at $1.75M
| Metric | Value | Source |
|---|---|---|
| Median House Price | $1,750,000 | CoreLogic, Q1 2026 |
| Annual Capital Growth | +5.8% to +9.7% | CoreLogic, PropertyValue |
| Average Days on Market | 26 | CoreLogic |
| Auction Clearance Rate | 72% | Domain |
| East-Side Premium | +10–15% vs west | PropertyValue |
26 days on market with 72% auction clearance — Rockdale is the fastest-selling suburb in the dataset. The east-side premium of 10–15% over west-of-railway properties creates distinct micro-markets within a single suburb. (CoreLogic, Domain — Q1 2026)
Rockdale's value proposition centres on transport infrastructure. Direct T4 line access to the CBD, combined with proposed light rail expansion, positions it as the most commuter-friendly suburb in St George outside Hurstville. The Rockdale Plaza precinct and ongoing urban renewal are driving a demographic shift toward young professionals and downsizers reassessing their options.
The growth rate spread (5.8% to 9.7% depending on source and time period) reflects different measurement methodologies — CoreLogic's hedonic index tends to report more conservatively than sales-based median calculations. For buyers comparing Rockdale against Brighton-Le-Sands, the key trade-off remains: Rockdale offers superior transport and value, Brighton-Le-Sands offers lifestyle and beachfront. Investors should also review the detailed suburb profile for Rockdale and selling costs analysis.
Banksia: Lowest Entry Point, Highest Unit Yield
| Metric | Value | Source |
|---|---|---|
| Median House Price | $1,800,000 | YIP, PropertyValue, Q1 2026 |
| Annual Capital Growth (Houses) | +4.35% | YIP |
| Gross Rental Yield (Houses) | 2.84% | YIP |
| Median Unit Price | $645,000 | YIP |
| Unit Rental Yield | 5.19% | YIP |
| Median Weekly Rent (Units) | $620 | YIP |
| Average Days on Market | 48 | PropertyValue |
| Auction Clearance Rate | 65% | PropertyValue |
5.19% gross unit yield — the highest of any suburb in this analysis. At $645,000 median entry, Banksia units offer the most accessible investment entry point in St George with rent of $620/week. (YourInvestmentPropertyMag, Q1 2026)
Banksia is the smallest suburb in the 2216 postcode at approximately 0.9 square kilometres, but its investment metrics punch above its weight. The 5.19% gross yield on units significantly exceeds the St George average, driven by relatively affordable purchase prices against firm rental demand. The T4 Banksia station provides the same direct CBD access as Rockdale.
The 48-day average time on market (PropertyValue) is notably longer than neighbours Rockdale (26 days) and Bexley (27 days), suggesting less competitive bidding pressure — potentially advantageous for negotiating buyers. Population data shows 75.5% owner-occupancy (ABS Census 2021), indicating a stable, family-oriented community. For first-home buyers navigating St George, Banksia's combination of low entry price, high yield, and direct train access makes it the leading candidate for a first investment property. Our Banksia suburb guide and selling cost analysis provide further detail.
Penshurst: Steady Growth at $1.93M
| Metric | Value | Source |
|---|---|---|
| Median House Price | $1,930,000 | YIP, PropertyValue, Q1 2026 |
| Annual Capital Growth | +5.75% | YIP |
| Gross Rental Yield (Houses) | 2.52% | YIP |
| Median Weekly Rent | $850 | YIP, PropertyValue |
| House Sales (12 months) | 71 | YIP, PropertyValue |
| Average Days on Market | 54 | YIP |
71 house sales in 12 months — Penshurst's transaction volume provides the most statistically robust median in this analysis. The 5.75% annual growth sits in the middle of the St George range but offers greater price confidence. (YourInvestmentPropertyMag, PropertyValue — Q1 2026)
Penshurst sits adjacent to Hurstville and benefits from spillover demand as buyers priced out of the $2.2M Hurstville median seek comparable value one station south. The T4 Penshurst station provides the same CBD train access, and the suburb's quieter, residential character appeals to families.
At 54 days average on market (YIP), Penshurst properties take longer to sell than the more competitive inner-St George suburbs. This reflects a more considered buyer profile — families typically evaluating school catchments and long-term community fit rather than making rapid investment decisions. The $1,930,000 median positions Penshurst as a mid-range option between the premium Hurstville/Brighton-Le-Sands tier and the more affordable Bexley/Banksia entry point.
Rental Vacancy and Market Conditions
| Region | Vacancy Rate | Period | Source |
|---|---|---|---|
| St George | 1.1% | February 2026 | SQM Research |
| St George | 1.2% | January 2026 | SQM Research |
| St George | 1.3% | July 2025 | SQM Research |
| Sydney (all) | 1.3% | February 2026 | SQM Research |
| National | 1.1% | February 2026 | SQM Research |
1.1% vacancy rate in St George — falling from 1.3% in July 2025, now below the 1.3% Sydney average. A vacancy rate below 2% is widely considered a landlord's market. (SQM Research, February 2026)
St George's vacancy rate trajectory — from 1.3% in July 2025 to 1.1% in February 2026 — signals an increasingly tight rental market. SQM Research's Managing Director Louis Christopher noted that without significant new housing supply and easing demand, rental pressures are expected to persist through much of 2026.
For investors, this data supports a rental income thesis across the region. The tightest conditions favour landlords in suburbs with high unit density like Kogarah (344 unit sales, 5.06% yield — YIP), Hurstville (495 unit sales, 4.96% yield), and Banksia (5.19% yield). For sellers considering timing, the current Q1 2026 market conditions and RBA rate trajectory provide additional context.
Sydney Market Context
| Metric | Value | Source |
|---|---|---|
| Sydney Median House Price | $1,601,782 | Cotality/CoreLogic, March 2026 |
| Sydney Median Unit Price | $911,743 | Cotality/CoreLogic, March 2026 |
| RBA Cash Rate | 3.85% | RBA, February 2026 |
| Domain Forecast (Houses) | +7% to $1.92M | Domain, 2026 full year |
| Westpac Forecast | +5% | Westpac, 2026 |
| NAB Forecast | +4.2% | NAB, 2026 |
| CBA Forecast | +3% | CBA, 2026 |
| ANZ Forecast | +2.5% | ANZ, 2026 |
| NSW Population Projection | +1M by 2034 | NSW Government |
The consensus among Australia's four major banks is that Sydney prices will continue rising through 2026, with forecasts ranging from ANZ's conservative +2.5% to Westpac's +5%. Domain's more bullish +7% forecast accounts for first-home buyer stimulus (properties up to $1.5M with 5% deposit), ongoing supply constraints, and population growth pressures.
St George suburbs are positioned above the Sydney-wide median across the board — the average house price of the six suburbs analysed ($1.91M) sits 19.5% above the Sydney median ($1.60M). This premium reflects the region's transport connectivity, established amenities, and proximity to both the CBD and Sydney Airport.
Methodology
Data Sources: CoreLogic (via YourInvestmentPropertyMag.com.au), Domain.com.au, PropertyValue.com.au, SQM Research, Cotality/CoreLogic, RBA, ABS Census 2021.
Date Range: All price and yield data reflects 12-month rolling medians as of Q1 2026 (January–March 2026). Vacancy data is sourced from SQM Research's February 2026 release. Population data is from the 2021 ABS Census (the most recent available).
Limitations:
- Median prices are based on recorded sales and may not capture off-market transactions.
- Suburbs with low transaction volumes (e.g., Brighton-Le-Sands with 35 house sales) produce less statistically reliable medians than high-volume suburbs (e.g., Hurstville with 143 sales).
- Growth rates vary between data providers due to different methodologies: CoreLogic uses a hedonic (repeat-sales adjusted) index while Domain and PropertyValue report simple sales-based medians.
- Rental yields are calculated as gross yield (annual rent ÷ median price) and do not account for vacancy, management fees, maintenance, or other holding costs.
- Some suburbs lack complete data across all metrics — indicated by dashes in the summary table.
- This analysis covers the six highest-demand suburbs in St George based on search volume and transaction data. Other suburbs in the St George region (including Arncliffe, Sans Souci, Kogarah Bay, and Carlton) are not included in the detailed analysis.
Frequently Asked Questions
What is the cheapest suburb to buy in St George in 2026?
Banksia offers the lowest entry point in St George, with a median unit price of $645,000 and median house price of $1,800,000 (YourInvestmentPropertyMag, Q1 2026). Banksia units also deliver the highest gross yield in the region at 5.19%, making it the leading option for first-home buyers and budget-conscious investors.
Which St George suburb has the highest rental yield?
Banksia units lead at 5.19% gross yield, followed by Kogarah units at 4.3–5.06% and Hurstville units at 4.96% (YourInvestmentPropertyMag, CoreLogic, Q1 2026). For houses, Bexley's 2.9% is the highest recorded, though all St George house yields sit below the 3% threshold typically considered cash-flow positive.
Is St George a good area to invest in 2026?
St George's 1.1% rental vacancy rate (SQM Research, February 2026) is below the Sydney average of 1.3%, indicating strong rental demand. Annual house price growth ranges from 4.35% (Banksia) to 8.91% (Hurstville). Major bank forecasts project Sydney-wide growth of 2.5–5% through 2026, with St George suburbs trending above Sydney averages.
How do St George prices compare to the Sydney average?
The average house median across the six suburbs analysed is approximately $1.91M — 19.5% above the Sydney-wide median of $1,601,782 (Cotality/CoreLogic, March 2026). This premium reflects St George's transport connectivity, beachfront access, and proximity to the CBD and airport.
What is the vacancy rate in St George?
SQM Research reports the St George vacancy rate at 1.1% as of February 2026, down from 1.3% in July 2025. A vacancy rate below 2% is widely considered a landlord's market, and St George is now tighter than the 1.3% Sydney average.
Which suburb is growing the fastest in St George?
By annual capital growth, Hurstville leads at 8.91%, followed by Bexley at 8.0% and Brighton-Le-Sands at 7.5% (CoreLogic, Domain, Q1 2026). For unit growth, Brighton-Le-Sands leads with 11.0% annual appreciation.
Should I buy a house or unit in St George?
Houses in St George deliver stronger capital growth (5.75–8.91% annual) but lower yields (2.39–2.9%). Units deliver lower growth but significantly higher yields (4.09–5.19%). Your choice depends on whether you prioritise long-term wealth building (houses) or rental income (units). The RBA rate environment and your personal cash flow position should inform this decision.
Sources
1. CoreLogic via YourInvestmentPropertyMag.com.au — Suburb profiles for Hurstville (2220), Banksia (2216), Penshurst (2222), Kogarah (2217). Median prices, yields, growth rates, and transaction data. Accessed April 2026.
2. Domain.com.au — Suburb profiles for Brighton-Le-Sands (2216), Bexley (2207), Rockdale (2216). Median prices by bedroom count, days on market, and clearance rates. Accessed April 2026.
3. PropertyValue.com.au — Suburb market data for Rockdale (2216), Banksia (2216), Penshurst (2222), Brighton-Le-Sands (2216). Median values, growth rates, and demographic data. Accessed April 2026.
4. SQM Research — National Vacancy Rates reports: July 2025, November 2025, February 2026. St George region vacancy data. sqmresearch.com.au.
5. Cotality/CoreLogic — Australian median dwelling, house, and unit prices. March 2026 Home Value Index. Via PropertyUpdate.com.au.
6. Reserve Bank of Australia (RBA) — Official Cash Rate of 3.85%, February 2026. rba.gov.au.
7. Domain Property Forecast 2026 — Sydney house price forecast of +7% to $1.92M. Via PropertyUpdate.com.au.
8. Major Bank Forecasts — Westpac (+5%), NAB (+4.2%), CBA (+3%), ANZ (+2.5%). Sydney residential price growth forecasts for 2026. Via OpenAgent.com.au and PropertyUpdate.com.au.
9. Australian Bureau of Statistics (ABS) — Census 2021 population and household data for Banksia (2216). abs.gov.au.
10. NSW Government Population Projections — Projected +1 million residents in NSW by 2034. Via PropertyUpdate.com.au.
Last updated: 9 April 2026
Related Topics

Written by
Michael Kalinovski
Licensed Real Estate Agent with 25+ years experience in Sydney's St George region. Specialising in Rockdale, Brighton-Le-Sands, Sans Souci, and Kogarah. 5.0 Google rating from 127+ reviews.
View Full ProfileExpert Consultation with Michael Kalinovski
Navigating the 2026 property market in St George requires local expertise. Whether you're selling an investment property or looking for a free market appraisal, Michael Kalinovski offers 25+ years of St George experience and a 5.0-star Google rating from 127+ verified reviews.
Servicing Rockdale, Brighton-Le-Sands, Sans Souci, Kogarah, Banksia & all St George suburbs
You Might Also Like
Best Real Estate Agent Ramsgate 2217 – Michael Kalinovski | Century 21 Bayview
Best Real Estate Agent Monterey 2217 – Michael Kalinovski | Century 21 Bayview

Understanding Stamp Duty in NSW: A Complete Guide for St George Property Buyers in 2026